PyTorch Geometric
2 minute read
PyTorch Geometric 또는 PyG는 기하 딥러닝을 위한 가장 인기 있는 라이브러리 중 하나이며, W&B는 그래프 시각화 및 experiments 추적을 위해 이 라이브러리와 매우 잘 연동됩니다.
Pytorch Geometric을 설치한 후 다음 단계에 따라 시작하세요.
가입 및 API 키 생성
API 키는 사용자의 머신을 W&B에 인증합니다. 사용자 프로필에서 API 키를 생성할 수 있습니다.
- 오른쪽 상단 모서리에 있는 사용자 프로필 아이콘을 클릭합니다.
- User Settings를 선택한 다음 API Keys 섹션으로 스크롤합니다.
- Reveal을 클릭합니다. 표시된 API 키를 복사합니다. API 키를 숨기려면 페이지를 새로 고침하세요.
wandb 라이브러리 설치 및 로그인
wandb 라이브러리를 로컬에 설치하고 로그인하려면 다음을 수행합니다.
-
WANDB_API_KEY환경 변수를 API 키로 설정합니다.export WANDB_API_KEY=<your_api_key> -
wandb라이브러리를 설치하고 로그인합니다.pip install wandb wandb login
pip install wandb
import wandb
wandb.login()
!pip install wandb

import wandb
wandb.login()
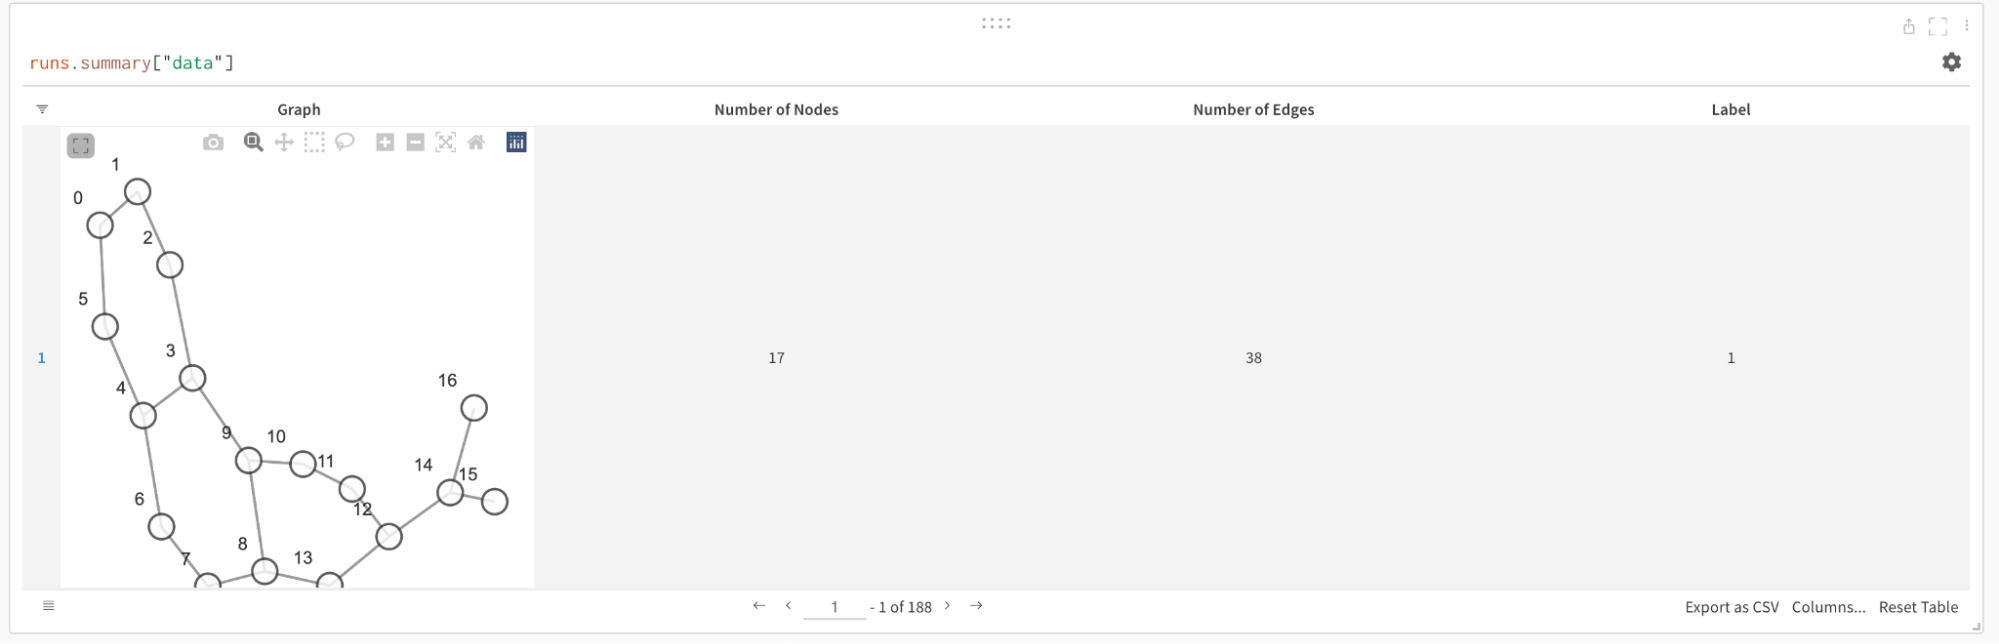
그래프 시각화
엣지 수, 노드 수 등 입력 그래프에 대한 세부 정보를 저장할 수 있습니다. W&B는 Plotly 차트 및 HTML 패널 로깅을 지원하므로 그래프에 대해 생성하는 모든 시각화를 W&B에 로깅할 수도 있습니다.
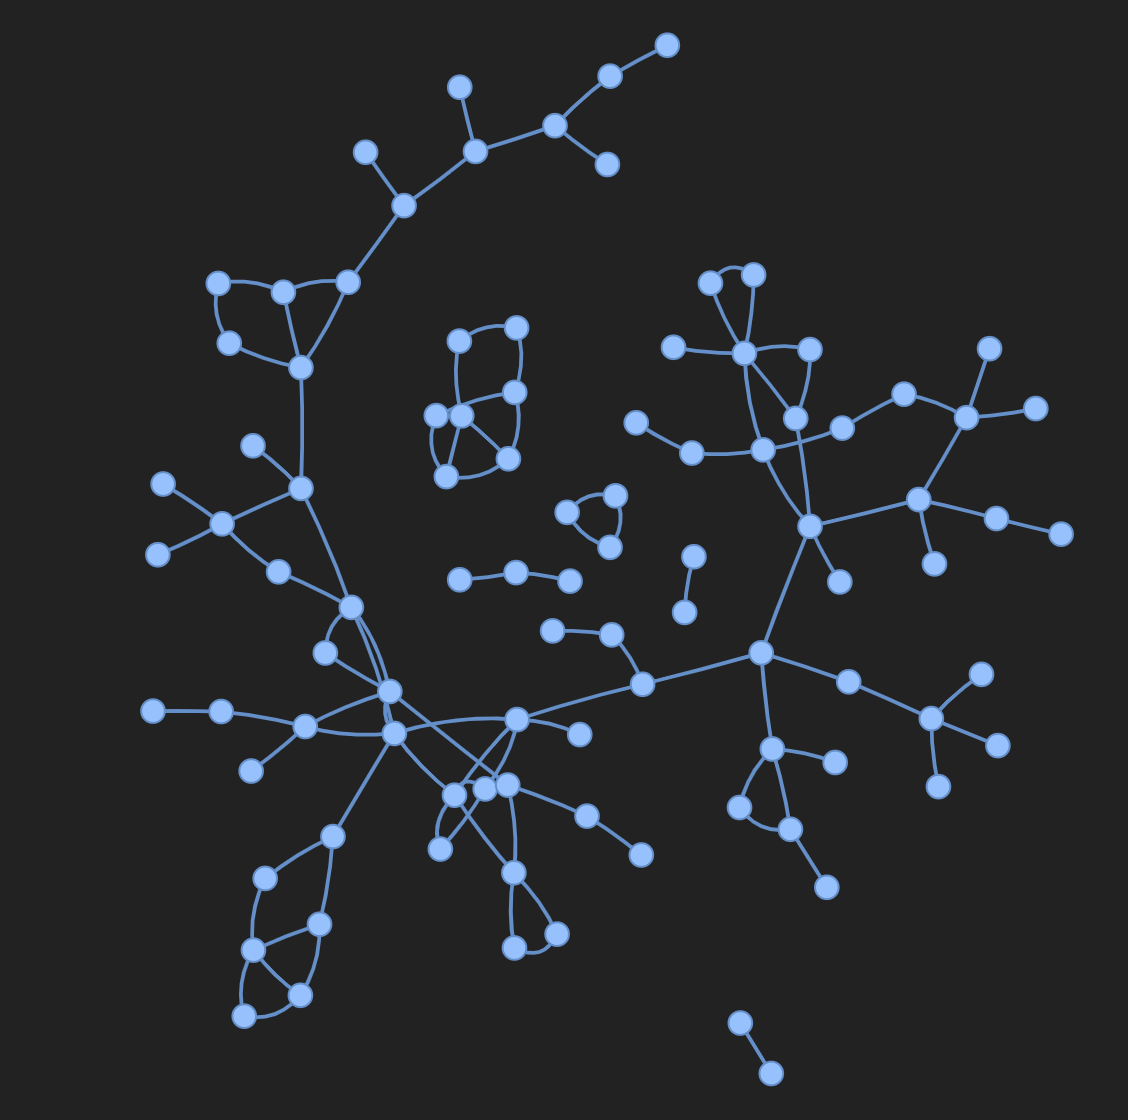
PyVis 사용
다음 스니펫은 PyVis 및 HTML을 사용하여 이를 수행하는 방법을 보여줍니다.
from pyvis.network import Network
Import wandb

wandb.init(project=’graph_vis’)
net = Network(height="750px", width="100%", bgcolor="#222222", font_color="white")

# Add the edges from the PyG graph to the PyVis network
for e in tqdm(g.edge_index.T):
    src = e[0].item()
    dst = e[1].item()

    net.add_node(dst)
    net.add_node(src)

    net.add_edge(src, dst, value=0.1)

# Save the PyVis visualisation to a HTML file
net.show("graph.html")
wandb.log({"eda/graph": wandb.Html("graph.html")})
wandb.finish()
Plotly 사용
Plotly를 사용하여 그래프 시각화를 만들려면 먼저 PyG 그래프를 networkx 오브젝트로 변환해야 합니다. 다음으로 노드와 엣지 모두에 대해 Plotly 산점도를 만들어야 합니다. 아래 스니펫을 이 작업에 사용할 수 있습니다.
def create_vis(graph):
    G = to_networkx(graph)
    pos = nx.spring_layout(G)

    edge_x = []
    edge_y = []
    for edge in G.edges():
        x0, y0 = pos[edge[0]]
        x1, y1 = pos[edge[1]]
        edge_x.append(x0)
        edge_x.append(x1)
        edge_x.append(None)
        edge_y.append(y0)
        edge_y.append(y1)
        edge_y.append(None)

    edge_trace = go.Scatter(
        x=edge_x, y=edge_y,
        line=dict(width=0.5, color='#888'),
        hoverinfo='none',
        mode='lines'
    )

    node_x = []
    node_y = []
    for node in G.nodes():
        x, y = pos[node]
        node_x.append(x)
        node_y.append(y)

    node_trace = go.Scatter(
        x=node_x, y=node_y,
        mode='markers',
        hoverinfo='text',
        line_width=2
    )

    fig = go.Figure(data=[edge_trace, node_trace], layout=go.Layout())

    return fig


wandb.init(project=’visualize_graph’)
wandb.log({‘graph’: wandb.Plotly(create_vis(graph))})
wandb.finish()
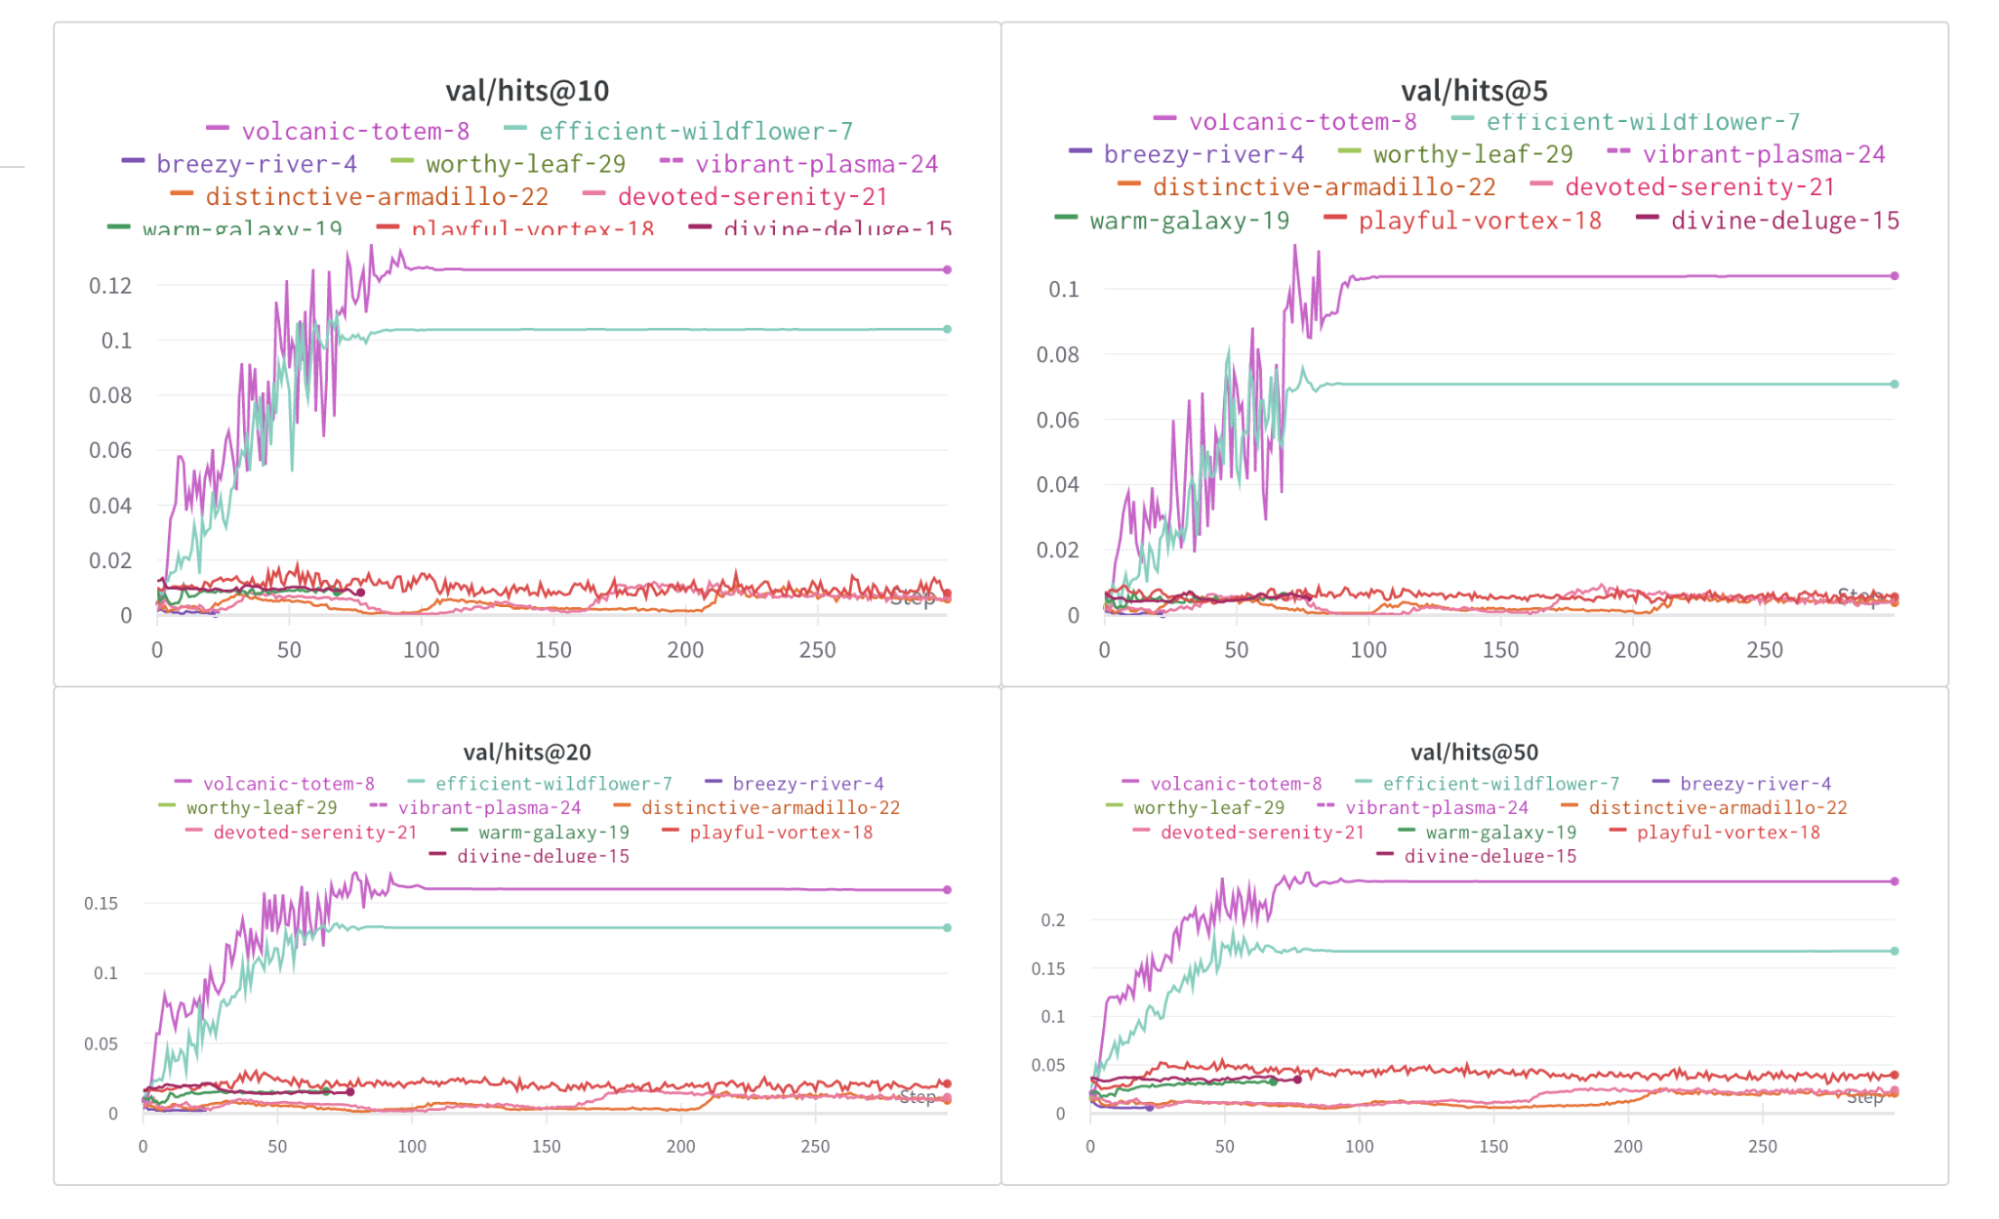
메트릭 기록
W&B를 사용하여 experiments 및 관련 메트릭(예: 손실 함수, 정확도 등)을 추적할 수 있습니다. 다음 줄을 트레이닝 루프에 추가합니다.
wandb.log({
	‘train/loss’: training_loss,
	‘train/acc’: training_acc,
	‘val/loss’: validation_loss,
	‘val/acc’: validation_acc
})
추가 자료
- PyTorch Geometric에서 그래프 신경망을 사용하여 Amazon 제품 추천
- PyTorch Geometric을 사용한 포인트 클라우드 분류
- PyTorch Geometric을 사용한 포인트 클라우드 분할
[i18n] feedback_title
[i18n] feedback_question
Glad to hear it! Please tell us how we can improve.
Sorry to hear that. Please tell us how we can improve.